
Are you working with directional data measured in degrees? Perhaps your research involves looking at patterns in the time of day of events, or things that occur in weekly, monthly or yearly cycles. These are circular data and they require special types of statistics. If you want to analyse this type of data, then Oriana is just what you need.
Oriana is a program written for Microsoft Windows. It calculates the special forms of sample and inter-sample statistics required for circular data. It also graphs your data in a variety of ways, allowing you to easily demonstrate patterns. These analyses and graphs are rarely found in other statistical packages.
Oriana is designed to be full featured and powerful, but also intuitive and easy to use.
Oriana Version 4 is now available. Click here for a list of the new features.
Analyses
Oriana calculates a variety of single sample statistics as well as inter-sample comparisons. The basic statistics include the circular mean, length of the mean vector, circular standard deviation and 95% and 99% confidence limits. There are also a number of single sample distribution tests, such as Rayleigh's test of uniformity and Rao's spacing test. Samples can be compared with various tests such as Watson-Williams test or Mardia-Watson-Wheeler test. Intersample correlations can also be calculated. A full list of analyses can be found here.
The results of the analyses are presented in a tabular format, ready for pasting directly into your word processor for a report or manuscript.
The number of variables and cases that Oriana can analyze is only limited by the amount of installed memory and disk space (up to 2 billion maximum).
Graphics
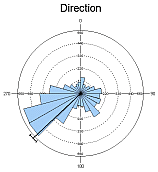
A variety of graph types are available in Oriana. The data for each set of observations can be summarized with rose diagrams or circular histograms. The rose diagram/histogram bars can be stacked to show the relative proportions of subsets within the data. Linear histograms can also be plotted.
Linear data can be incorporated into two variable rose diagrams or histograms as well as in vector plots, where an arrow or bar is drawn for each case, with the length representing the linear data, and circular scatterplots.Individual observations can be shown in raw data plots. Distribution plots allow you to assess whether the data depart from a uniform or von Mises distribution. The distributions of two sets of observations can also be compared with Q-Q plots, and regular scattergrams can also be produced.
Various aspects of the appearance of the graph can be modified, including fonts, colors of lines, objects and background, and text of titles and axis labels. When the graphs are ready you can print them to any Windows printer, save to various graphic formats, or copy and paste them to any other Windows application.
Full details of the graphics capabilities, and examples of the graphs, can be found here.
Data Handling
Oriana can natively handle a wide variety of data types. Besides angular data in degrees (either unidirectional or bidirectional), you can also enter your circular data as time of day, day of the week or month of the year (in your native language), or numeric week or day of the year. You can also enter data as compass directions (e.g. NW for north-west).
Oriana can also accept a variety of non-circular data types, including linear numeric, dates, labels, and a special subgrouping variable. These data can be paired with your circular data to identify cases, allow analysis of subgroups of data, or allow linear data to be incorporated into your graphs and analyses (through two-variable stacked histograms and circular-linear correlations).
Data are entered in a spreadsheet like editor, with special input assistance for some variable types (e.g. enter months by picking them from a list or just typing the first one or two letters, or picking dates off a pop-up calendar). Optionally, you can also enter data in the form of a frequency table.
Oriana can handle grouped circular data. These are data where the observations have been recorded approximately, to the nearest interval (e.g. to the nearest 20° or every hour), rather than recorded exactly. Oriana automatically detects grouped data and flags them (with user confirmation) so that statistical analyses are adjusted accordingly, where relevant. Oriana can also accept and automatically deal with missing data.
A variety of data manipulation functions are provided. These include filling variables with automatically generated data (identical, incrementing or random from a uniform or von Mises distribution) , sorting the data, summarizing dates into days of the week, months of the year, etc., changing between variable types, plus a find and replace facility.
The data can also be imported and exported from/to Excel (including Excel 2007/2010), Lotus 123, Quattro, dBase, Paradox and ASCII text. Data can also be pasted from any Windows program directly into the data editor.
Desktop Metaphor
Oriana uses the KCS desktop metaphor (see screen shot). You can spread out your data, the statistical results and several graphs in front of you while you study them, just like paper on your desktop. Try new graphs, add new data, peruse the results, then print or save just those that you need.
When you exit Oriana you can save the position and contents of all the windows on your desktop. Later you can restore it to the same state. Oriana lets you pick up where you left off. Multiple desktops can be saved for different projects.
A separate notepad window allows you to make notes about your analyses. These are saved along with the graphs and results in a desktop file, and can be copied or exported to your word processor.
The Oriana user interface has customizable toolbar, that let you add buttons for your most frequently used commands, and optional personalized menus initially only show your most recently used commands (as in Office XP™).
System Requirements
- Microsoft Windows 98SE/Windows NT 4 or later (including Windows ME/2000/XP/2003/Vista/7/8/10/11)
- 512Mb RAM memory
- 12Mb disk space
Download
You can download a demo version of the latest Oriana from here.
Prices and ordering
For prices, on-line ordering and other purchasing information please go to our ordering page.

