|
|
Sample screen shots
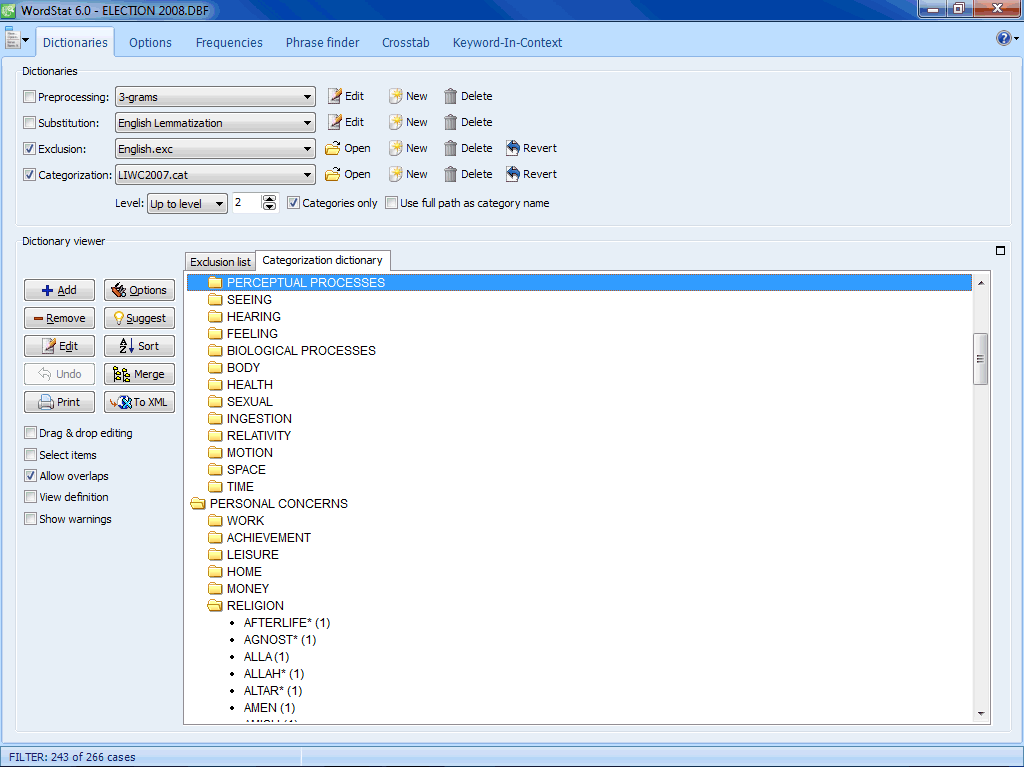 The Dictionary page allows one to adjust various text analysis processes, create and modify dictionaries, exclusion and substitution lists. |
 The Frequency page displays a frequency table of keywords or content categories. A suggestion panel on the right suggest synonyms and related words. |
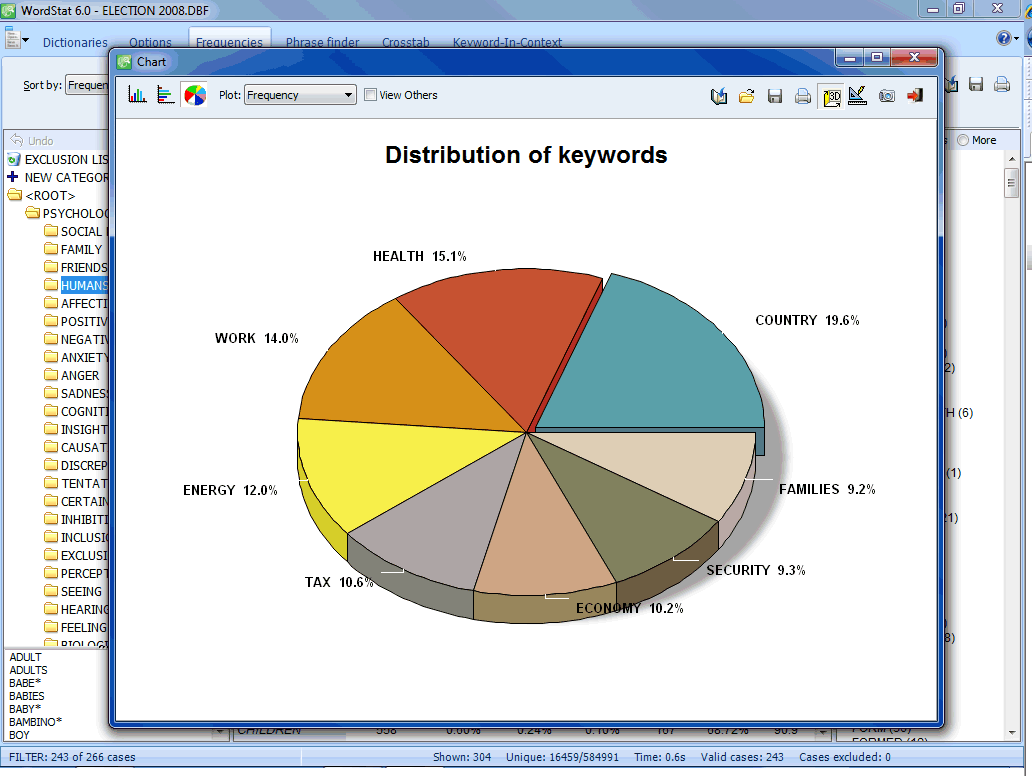 Frequencies can be plotted in a variety of ways, such as pie charts. |
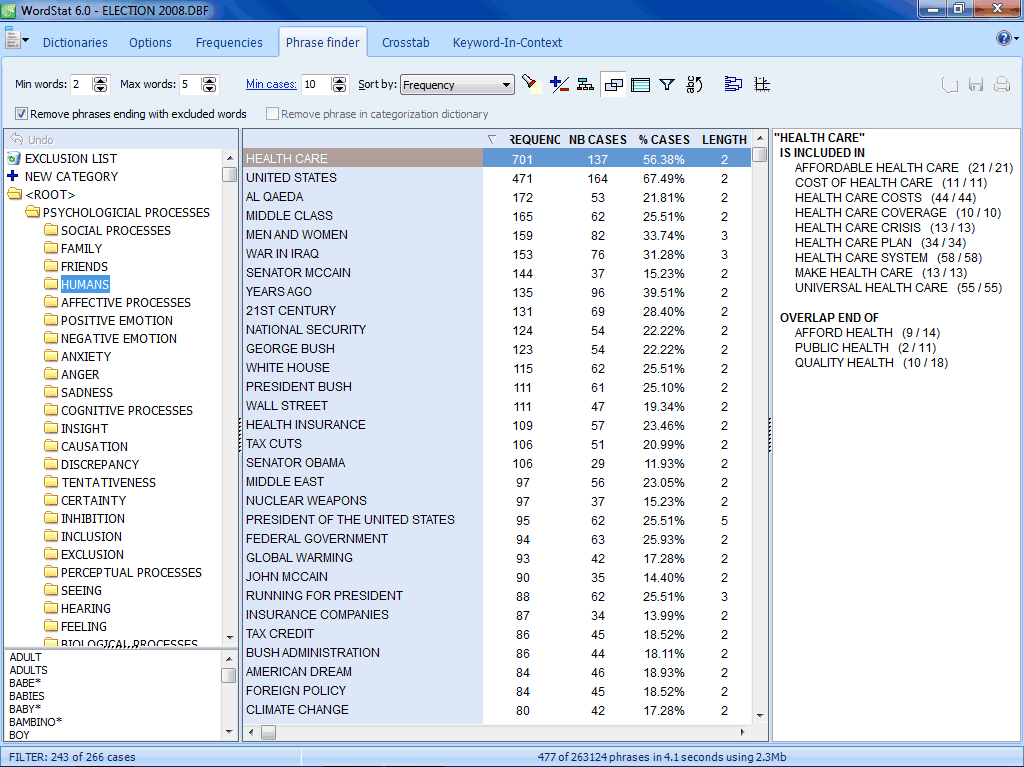 The Phrase Finder feature allows one to easily extract the most common phrases and idioms. |
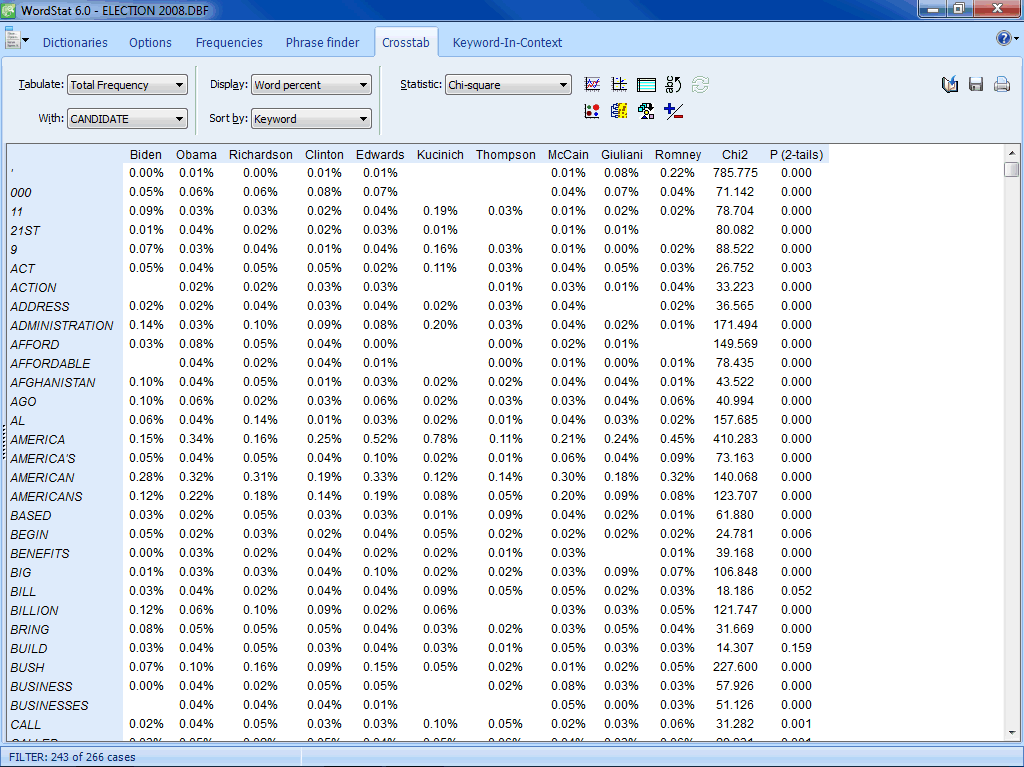 The Crosstab page allows one to compare keyword frequencies across values of numerical, categorical or date variables. |
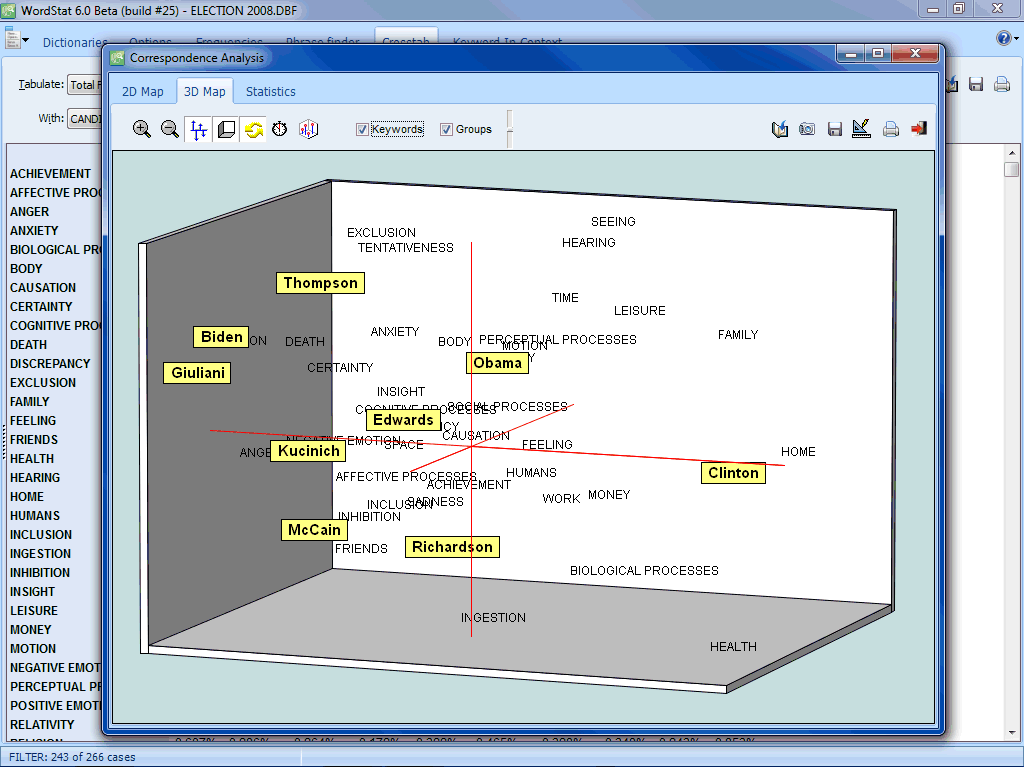 Correspondence analysis is a powerful exploratory technique to identify relationships between keywords and categorical or ordinal variables. |
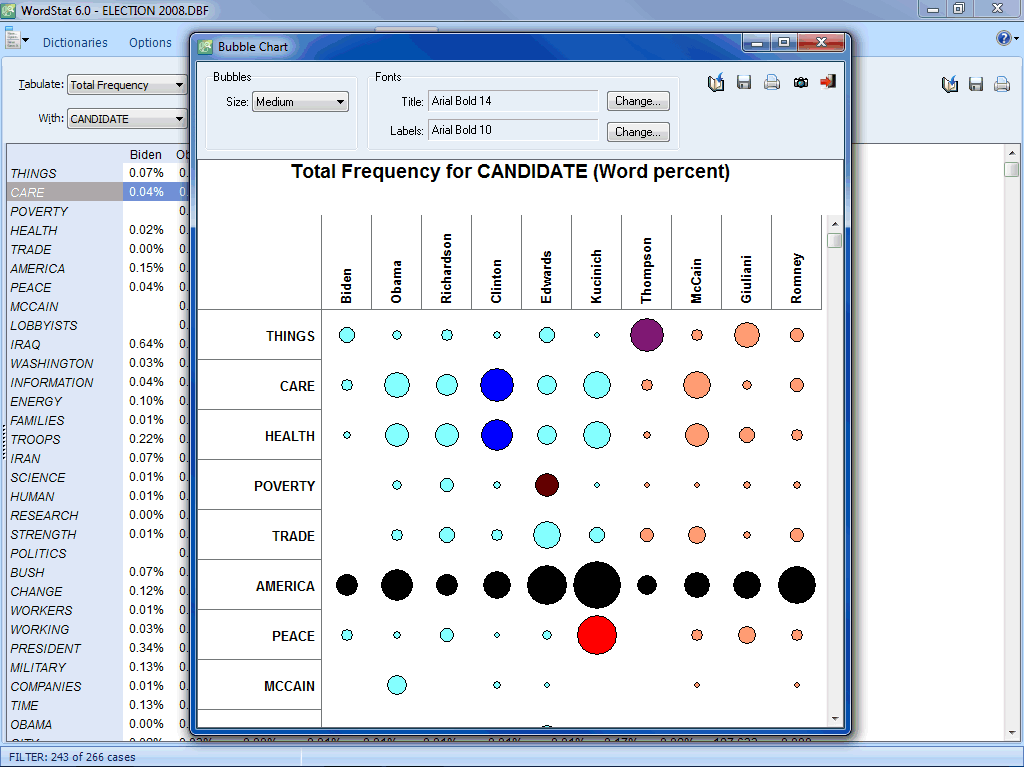 Bubble charts are graphic representations of contingency tables where relative frequencies are represented by circles of different diameters. |
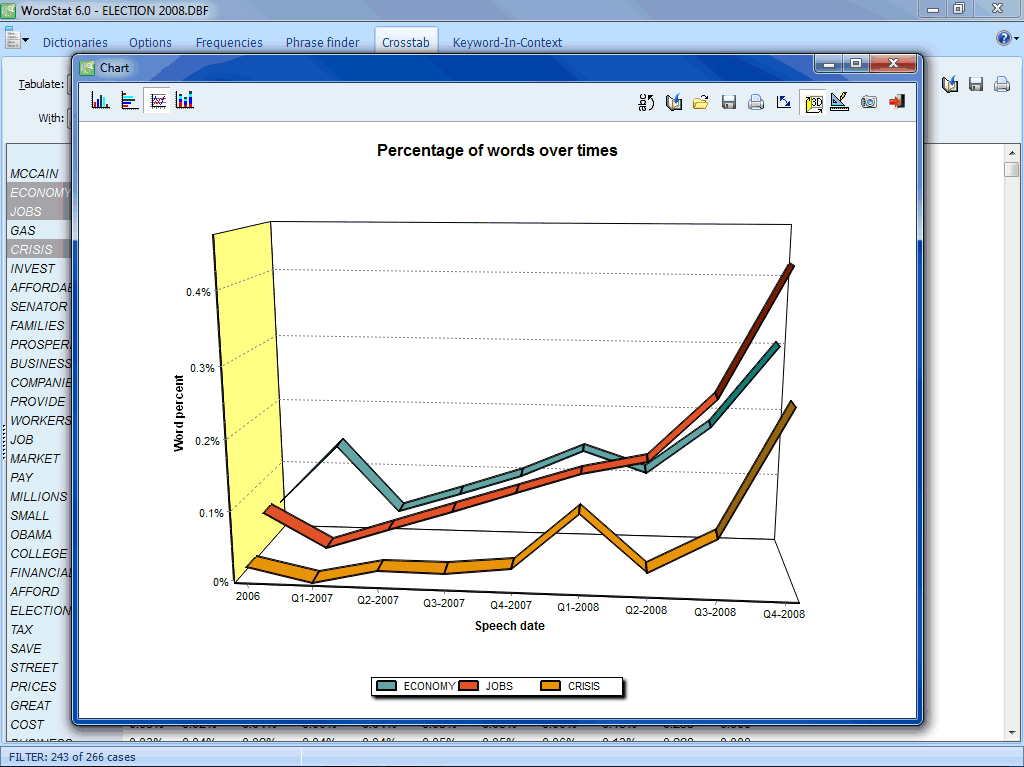 Temporal trends of content categories overtime may be plotted using line charts. |
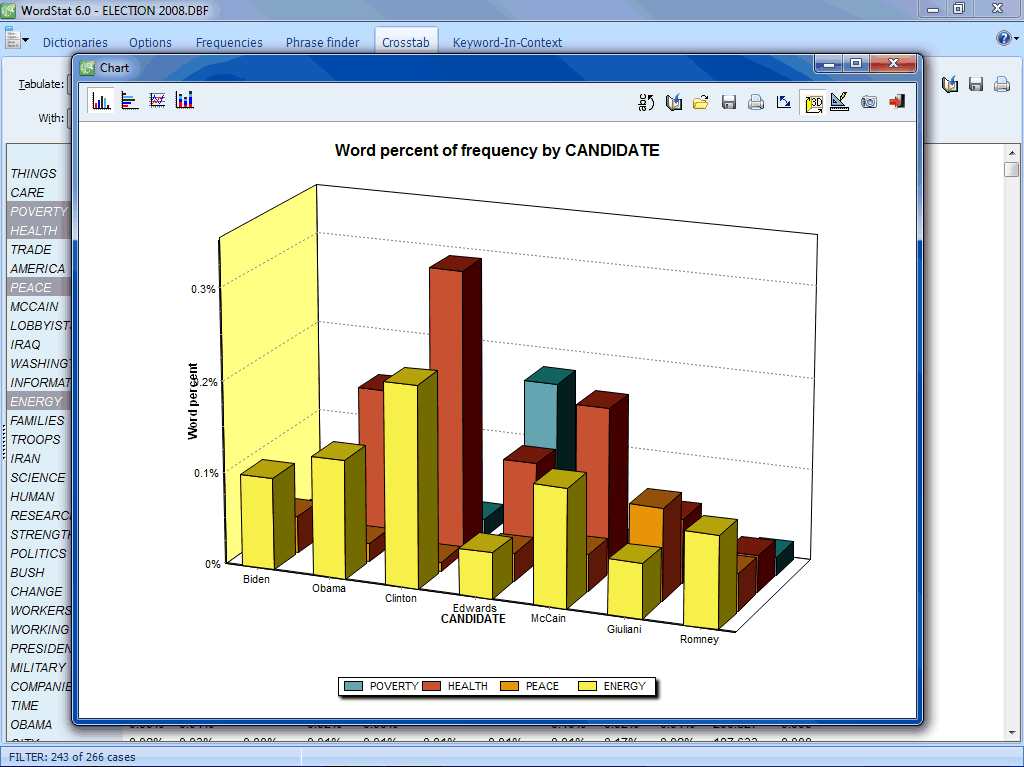 Presentation quality graphics such as pie charts and bar charts may be created to represent the frequency of keywords or content categories. |
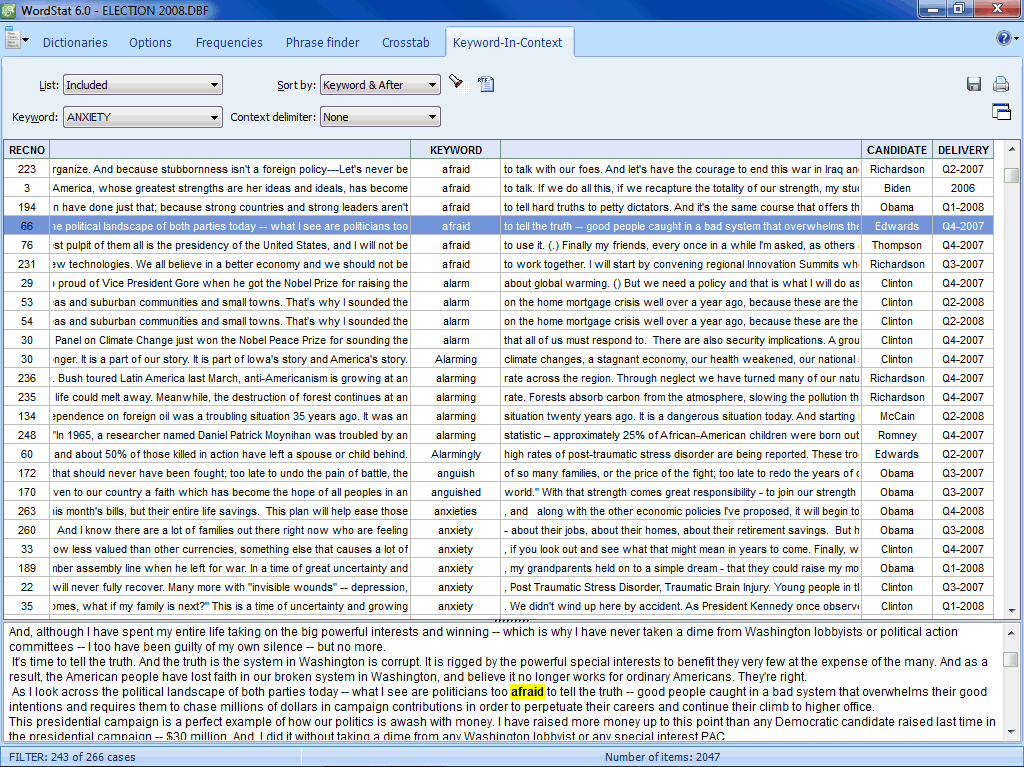 The Keyword-In-Context (or KWIC) page allows one to display the context of specific words, word patterns or phrases. |
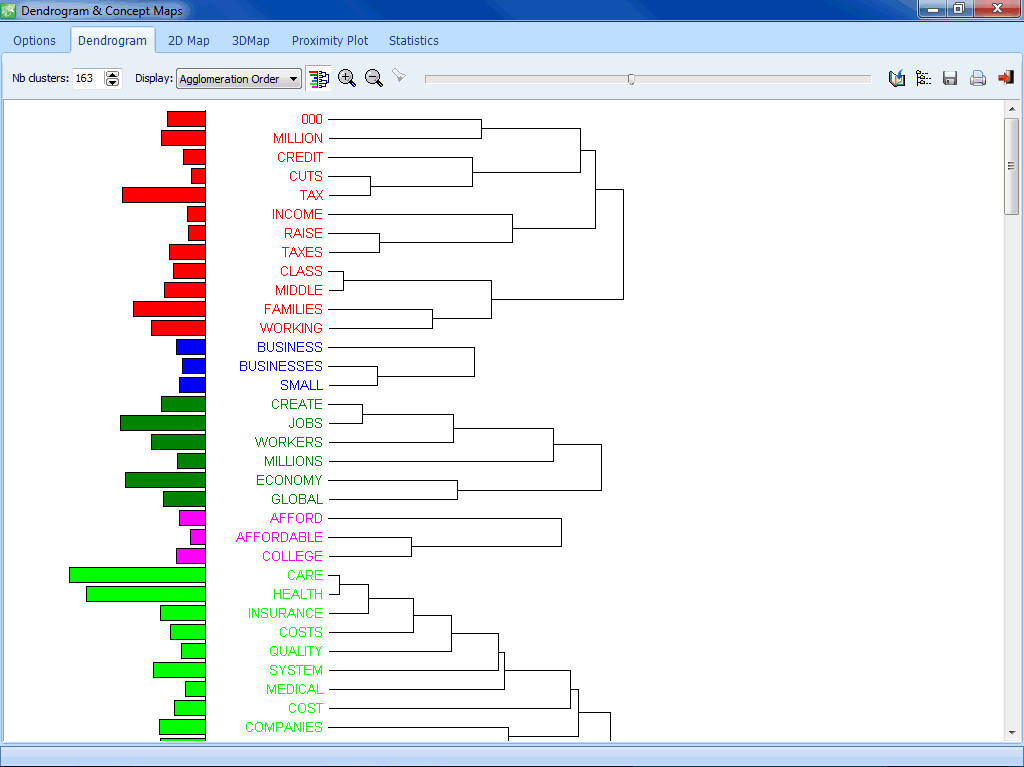 Hierarchical clustering is a useful exploratory tool to quickly identify themes or groupings of documents. |
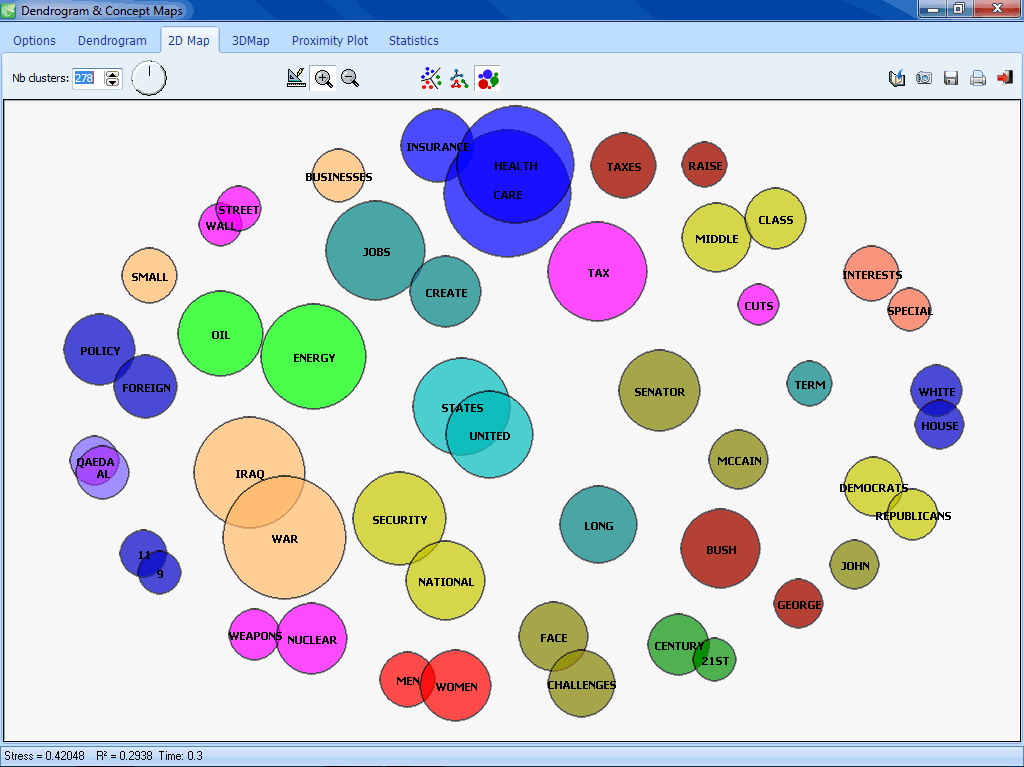 Multidimensional scaling maps may be used to represent the co-occurrence of keywords or similarity of documents. |
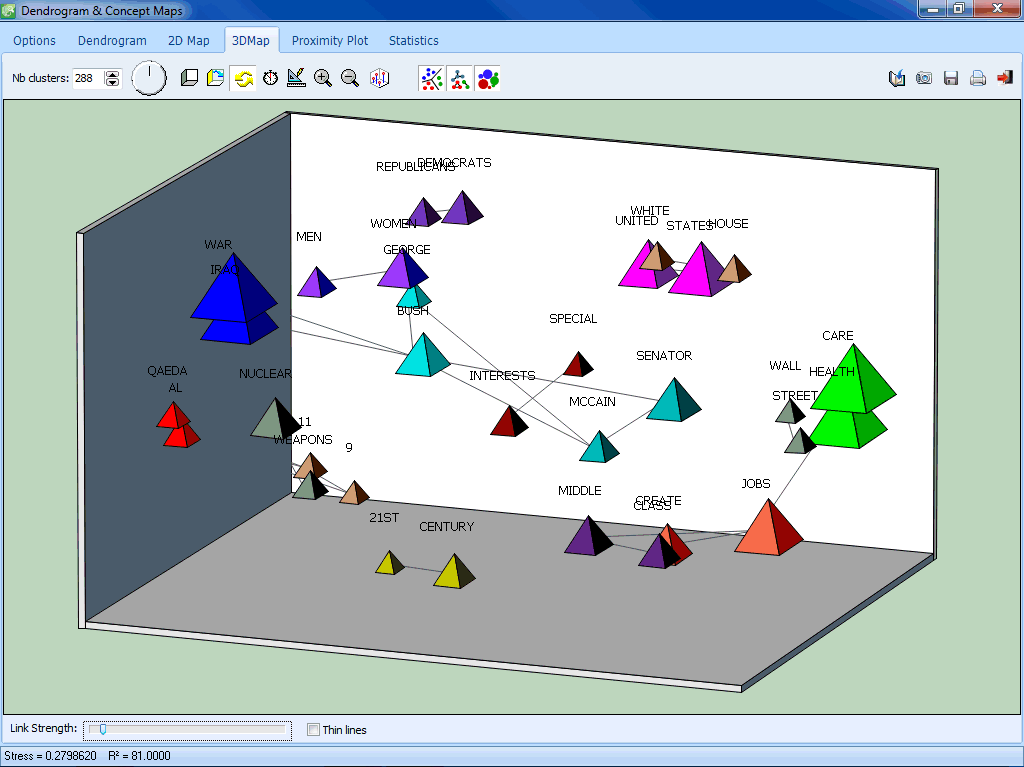 This multidimensional scaling displays lines representing the strength of association between data points. |
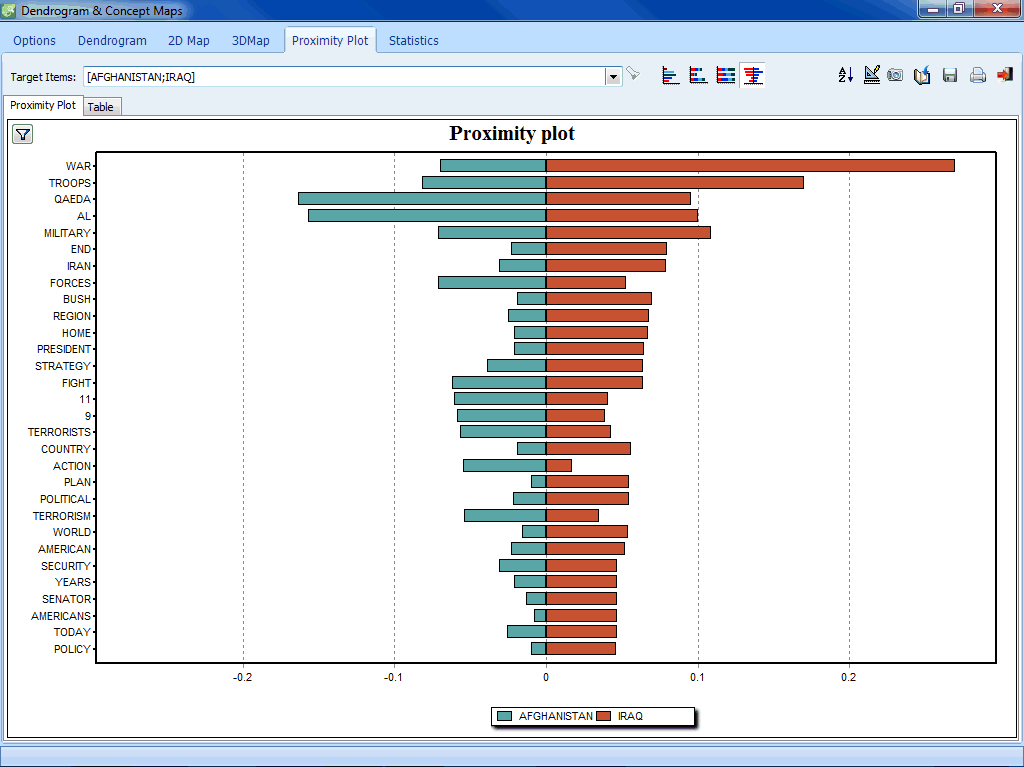 Proximity plots may be used to represent the distance from one or several target keywords to all other words. |
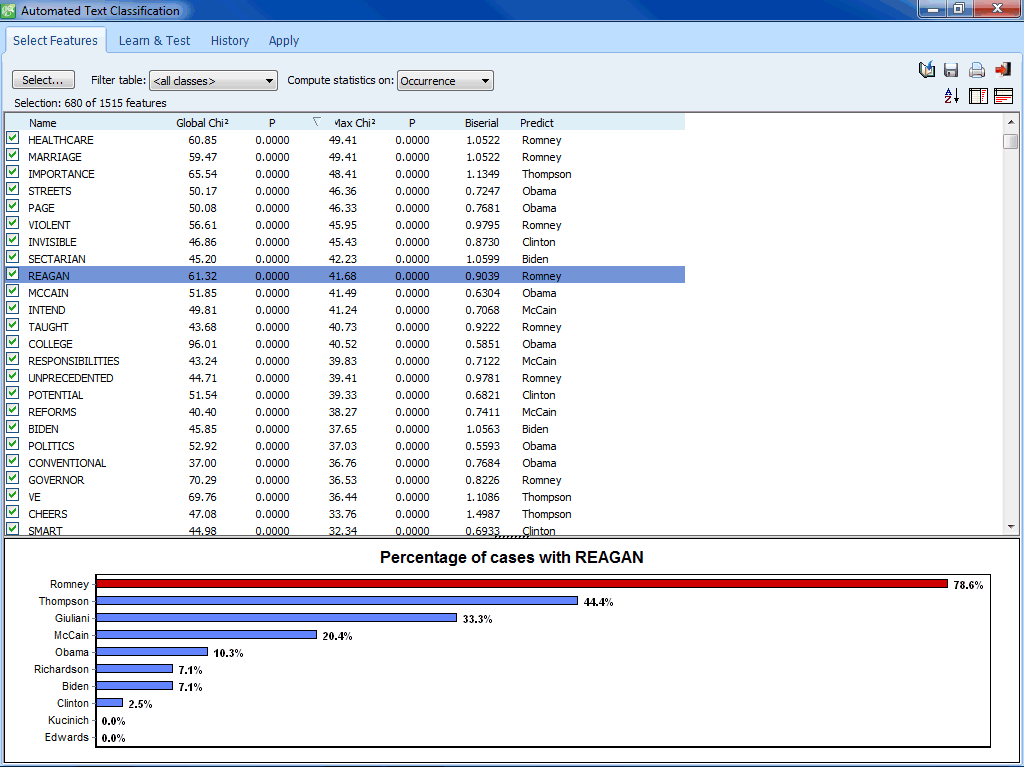 The Feature Selection page of the automatic document classification feature allows one to manually or automatically select keywords. |
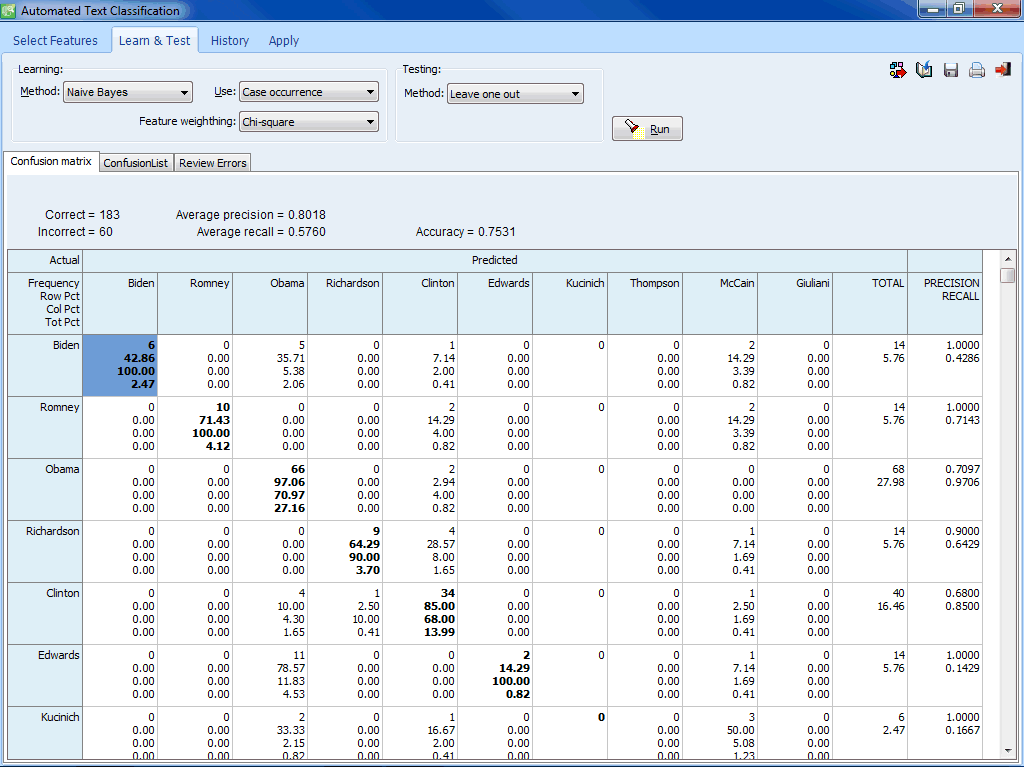 A confusion matrix is a useful tool to assess the performance of an automatic document classifier. |
 One can quickly perform a series of classification experiments and display them graphically. |
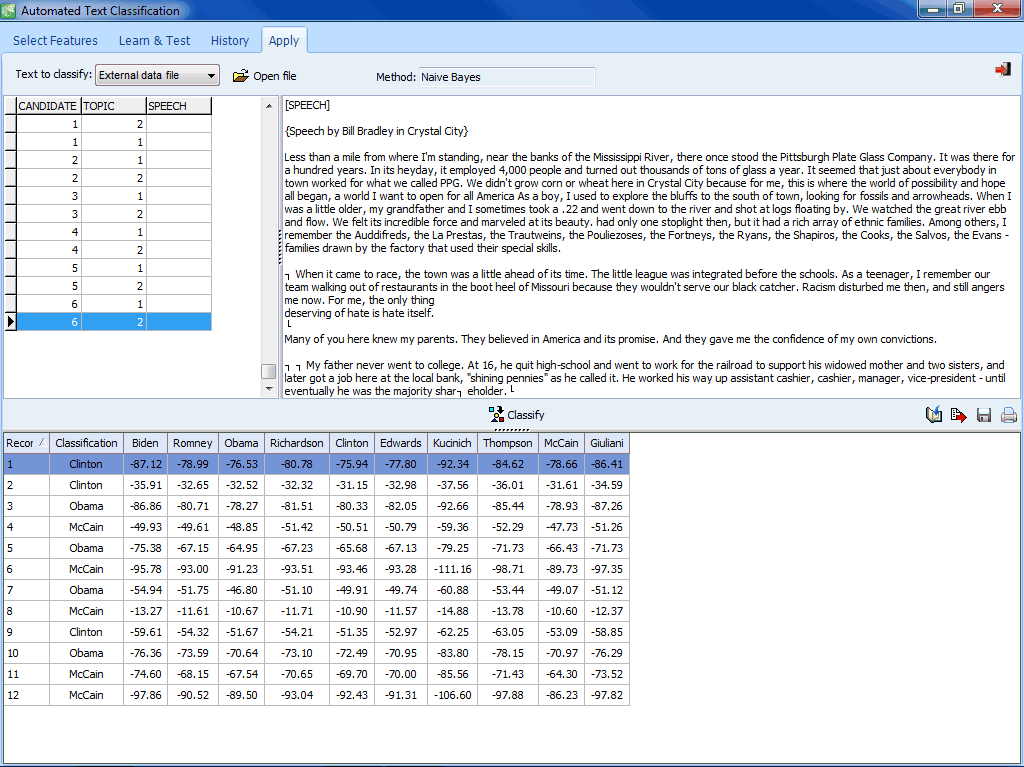 The Apply page allows one to categorize a single document, a list of files, or text variables in the current or an external data file. |