|
|
What's New in Version 5?
QDA Miner 5 is full of exciting new features and improvements. Here are some of the new applications that will help researchers and businesses keep abreast of the latest trends and give them faster access to the waves a new data being created every day.
Version 5.0 gives you new ways to access and analyze unstructured data. You can easily import web surveys, social media, email providers and reference management tools. The new GIS mapping tool allows you to relate geographic information in unstructured data, create maps and other graphic displays to enrich your analysis and presentations.
1. IMPORTATION FROM NEW SOURCES
QDA Miner 5 expands your reach to analyze unstructured data for your research or business needs. Import data from major email providers, web survey companies, social media and RSS feeds.
Web Survey Platform
• SurveyMonkey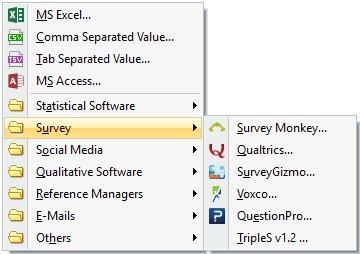
• SurveyGizmo
• QuestionPro
• Voxco
• Qualtrics
Reference Management Tools
• EndNote
• Zotero
• Mendeley
Email sources
• Outlook account and PST files
• Hotmail account
• Gmail account
• MBox
• EML
Social Media
• Twitter
• Facebook
• RSS Feeds
2. IMPORTATION AND MONITORING OF TWITTER, FACEBOOK, AND RSS FEEDS
Twitter and Facebook are a great source for getting the instantaneous pulse of people’s opinion, while RSS feeds are a good way of keeping oneself informed about what’s new on the web. In QDA Miner 5, not only can you create projects from a search on twitter, facebook or through an RSS feed, it comes with a standalone tool that will continually monitor in the background those sources and aggregate tweets, facebook comments or news on specific topics, allowing you to keep your data current.


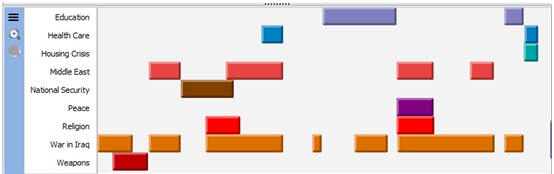
3. DOCUMENT OVERVIEW
A graphical overview of the codings of the current document can be displayed allowing one to get a quick glimpse of the spatial distribution of the coding. Bars can be sorted in alphabetical, frequency, first appearance, in codebook order, or by color hue. They may also be stacked to easily compare coding importance. The graphic display can be zoomed in or out, saved to disk or copied to the clipboard. Clicking a bar brings you the location of the corresponding segment in the text.
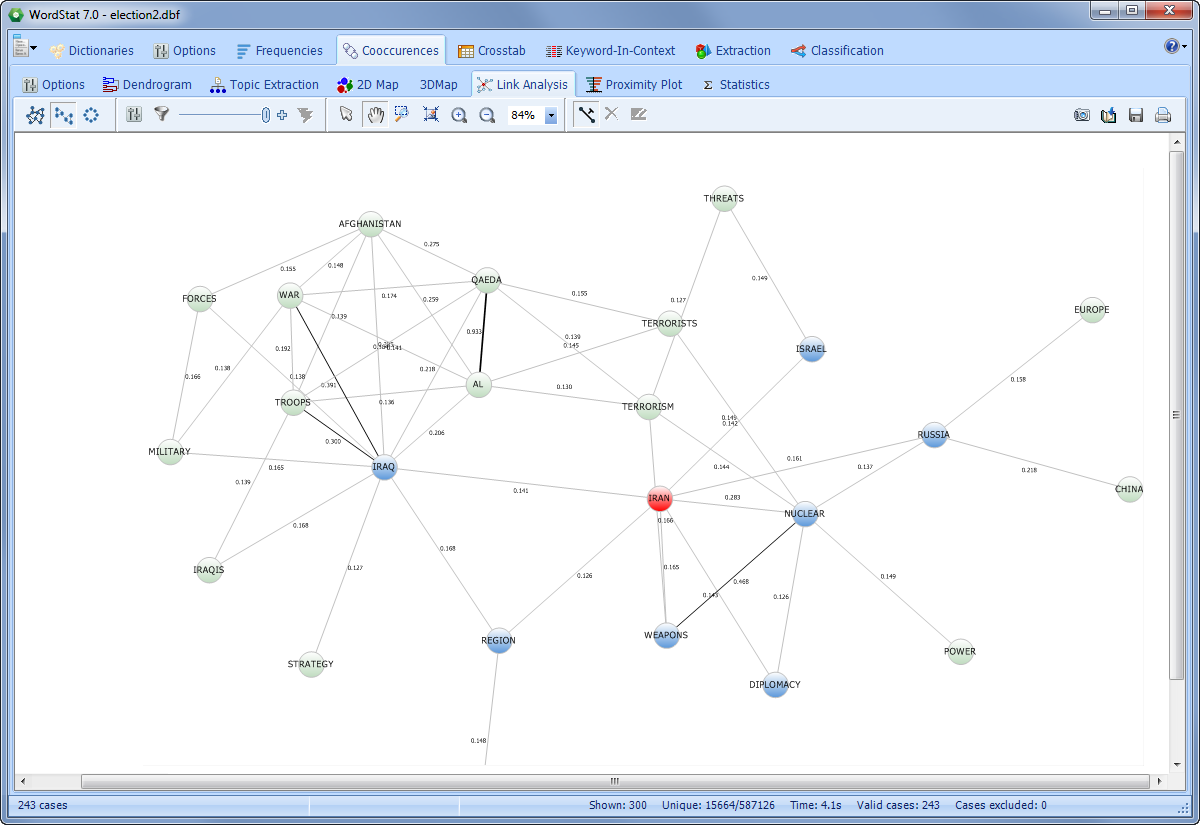
4. LINK ANALYSIS FEATURE
A new Link Analysis feature allows one to display co-occurrence of coding using force-based, multi-dimensional scaling or circular layouts. Graphs are interactive and may be used to explore connections between codings.
5. GEOCODING
Integrated geocoding service is available in QDA Miner to transform references to cities, states, provinces, countries, postal codes, and IP addresses into geographical coordinates. IP addresses may also be used to obtain the city, region or country of origin.
6. INTERACTIVE PLOT OF DATA POINTS
Plots of data points can be created from various retrieval dialogs (CODING RETRIEVAL, CODE SEQUENCE ANLAYSIS, CODING BY VARIABLES, and LINK RETRIEVAL. The GISViewer mapping module will then allow one to quickly filter data points on categorical, numerical, and date variables or create dynamic range displays and custom animations to easily identify temporal trends, cyclical patterns or relationships to numerical variables. Single data points can be customized and annotated.

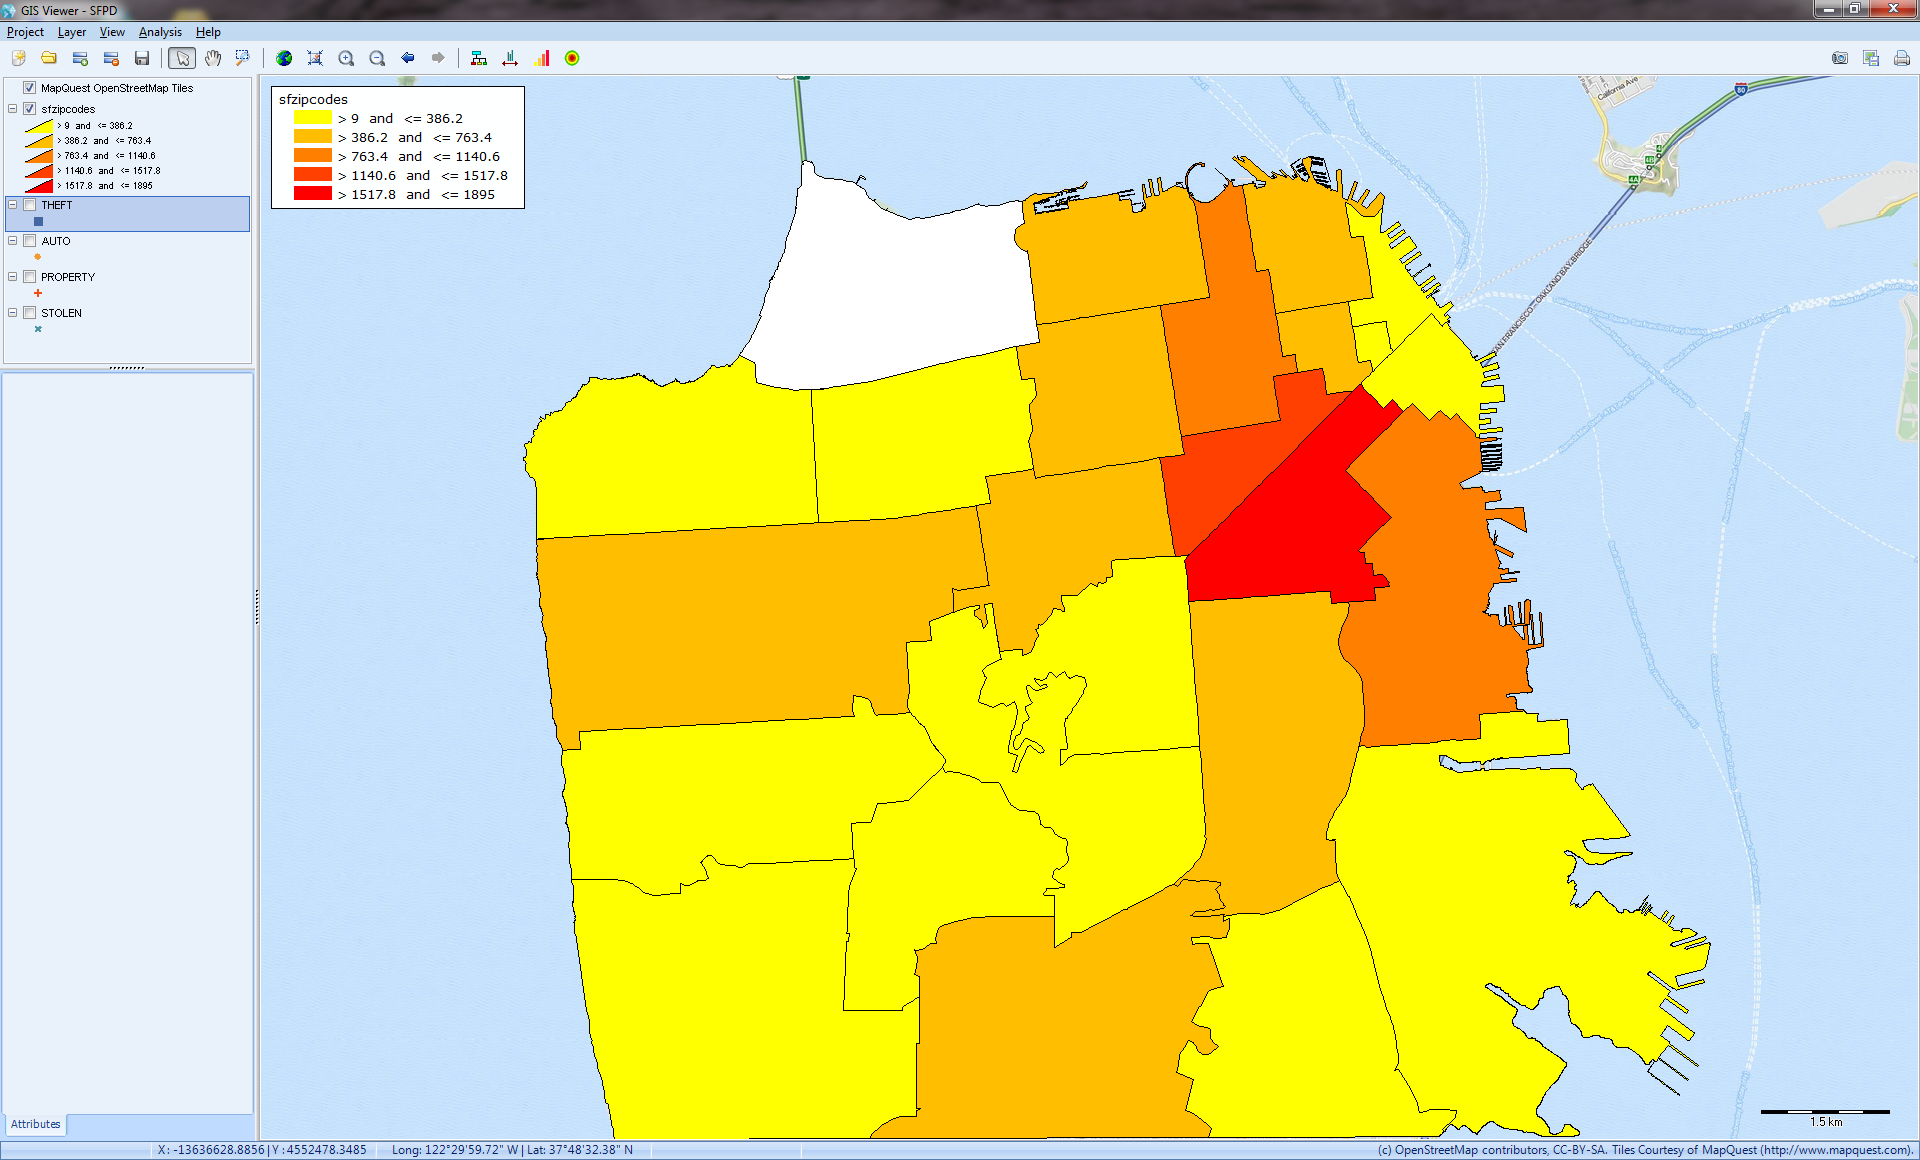
7. DISTRIBUTION MAPS
Users can create layers from various vector file formats and produce choropleth maps to represent point density, demographic information stored in shapefiles, or statistical summaries of numerical values associated with text segments. One can also easily adjust the color range, the number of steps and level of transparency.
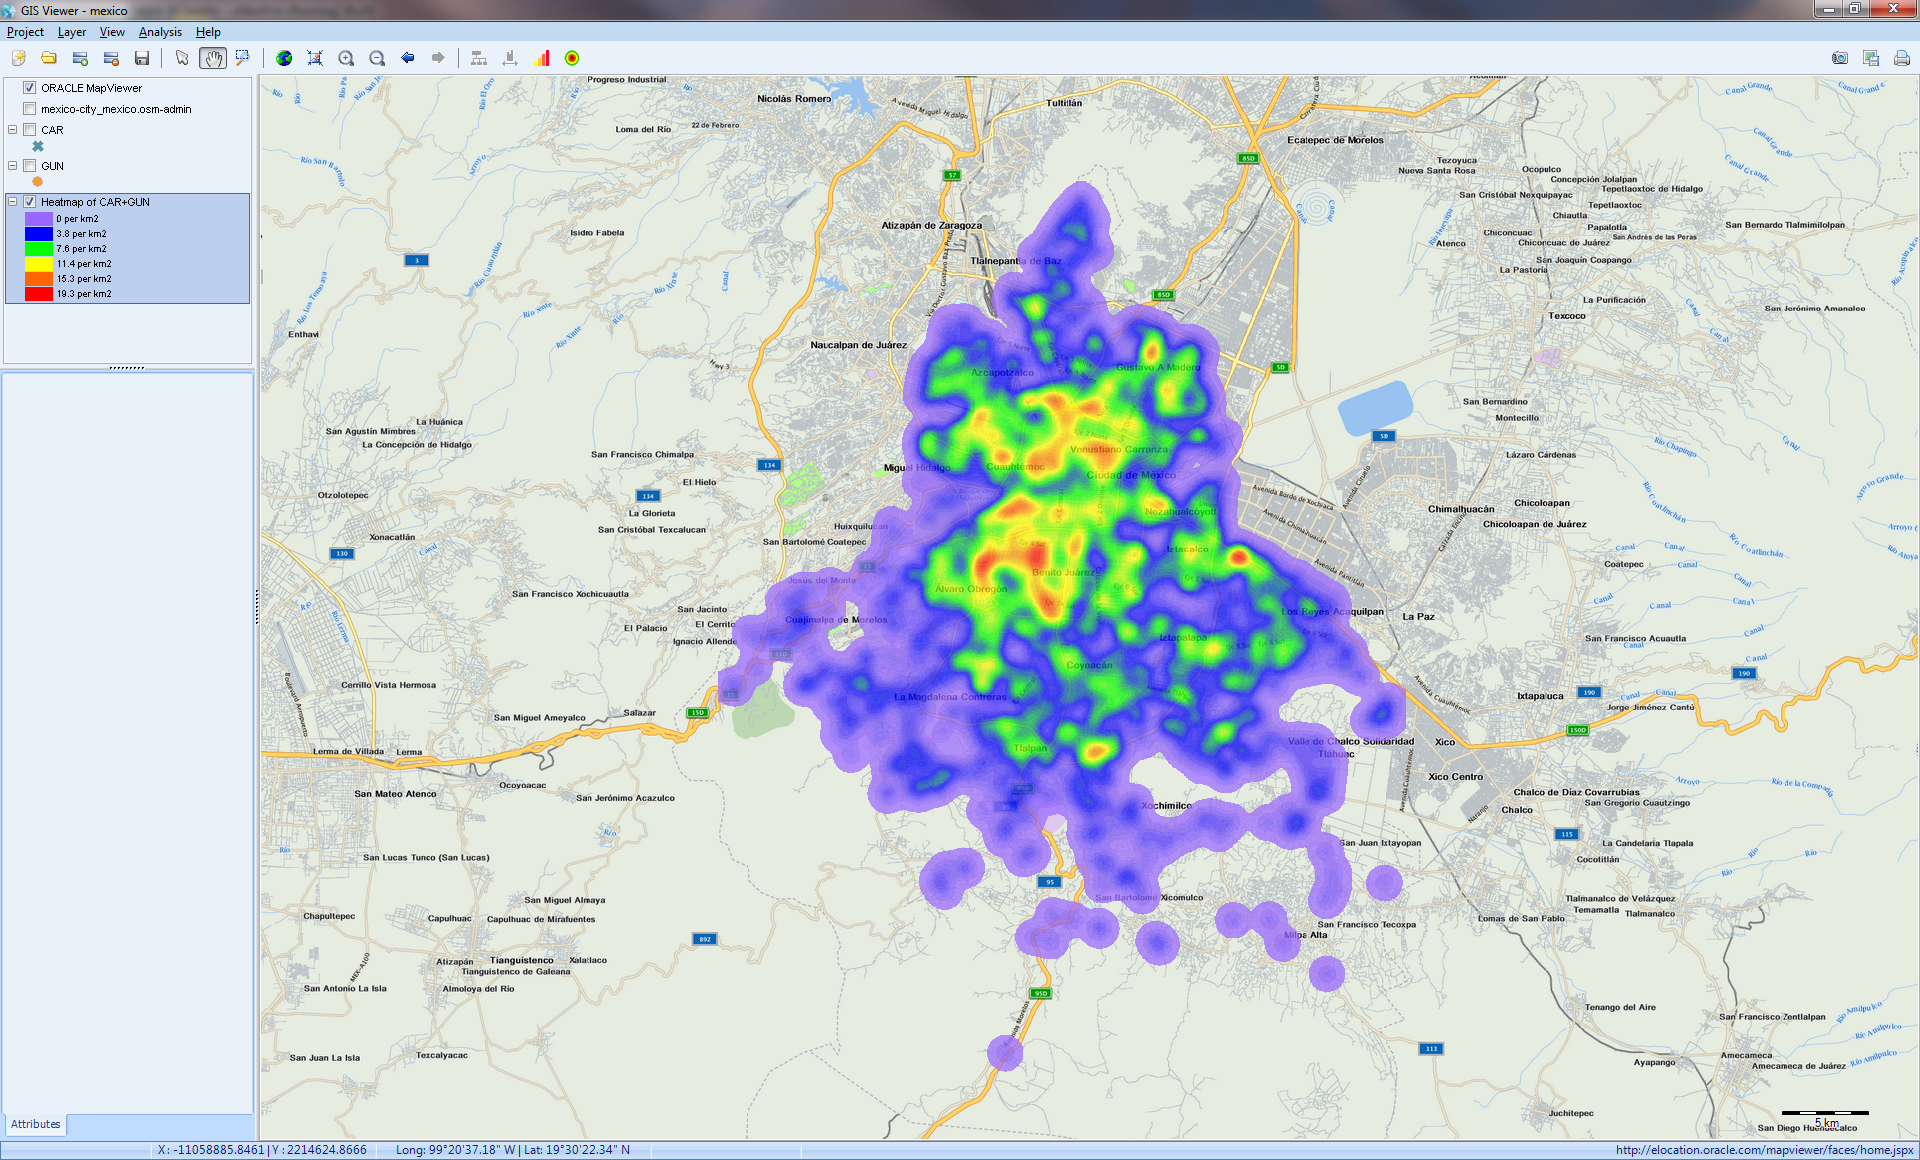
8. HEATMAPS
Density of data points can be visualized with heatmaps displays to easily identify customer concentrations, crime hot spots, or disease outbreaks. Users can also create heatmaps on all data point or just on selected regions and choose from a wide variety of color ramps or create their own.
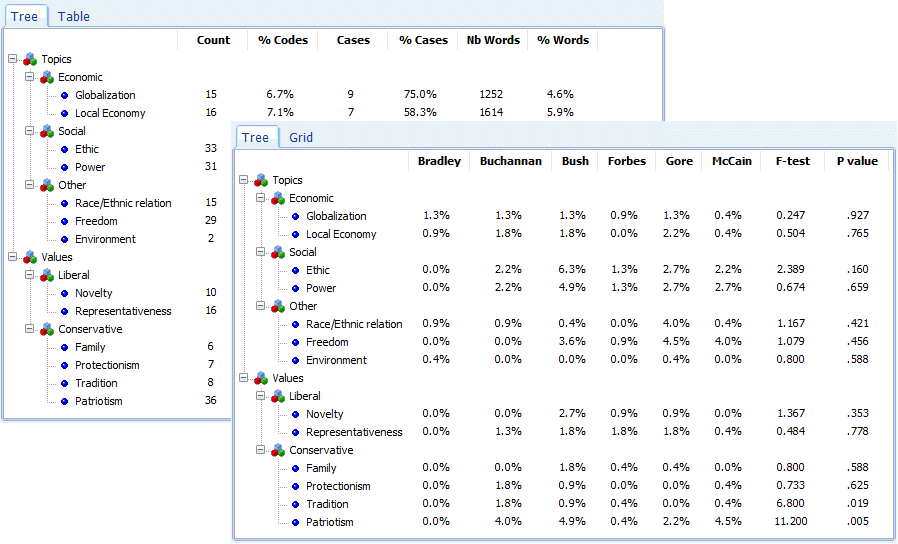
9. TREE GRID DISPLAY
A new tree grid report format for the CODING FREQUENCY and the CODING BY VARIABLE commands allows you to view the results organized according to the codebook hierarchical structure.
10. DUPLICATE CASES IDENTIFICATION
Duplicate cases may occur for many reasons, including data importation, data entry or data management errors, or may occur naturally such as twitter and other online sources (ads, news lines, press releases, etc.). Such duplication may affect the program’s ability to extract relevant features (topics, phrases, etc.) or statistics. The new CASES | DUPLICATES command allows one to identify, tag, select, filter out, or delete duplicate observations. A variable can be created to indicate whether a case is unique, has duplicates (primary) or is such a duplicate. A numerical variable with sequential values may also be created and used for ordering cases on their content.
11. MONITORING FOLDERS, FILES OR ONLINE RESOURCES
The new CASES | MONITORING command allows you to configure a QDA Miner project to monitor a specific folder, and automatically import any documents and images stored in this folder. File may then be automatically deleted or moved to another location. It can also monitor changes to the original source file or online service such as web services, E-mail accounts or reference management tools, allowing you to import any new case, survey response, email, tweet, and so on.
12. VARIABLE EXTRACTION
A new VARIABLES | EXTRACT command allows you to transform coded text into variables, with optional extraction of dates, date and time, numeric values, or text strings. Very useful to extract relevant meta data from unstructured documents or transform an unstructured project into a structured one.
13. EXTRACTION OF JPEG META DATA
JPEG photos and images may contain a lot of information, such as the geographic location where a photo has been taken, a title and description added by its author, or even comments or tags attached by him or by viewers. The new importation routine allows to import all those information and transform them into variables. One may then use those variables in combination to the new GIS feature to plot coded image properties on a map, look at their spatial distribution. Extracted information currently includes:
• Geographic coordinates (latitude and longitude)
• Author
• Title
• Description
• Comments
• Tags
• Camera maker and model
14. CHARTING OF DOCUMENT CODING
The new DOCUMENTS | CHART feature allows one to create bar charts, pie charts or tag clouds representing the distribution of codes in a single document.
15. NUMEROUS SPEED OPTIMIZATION
QDA Miner already has an excellent reputation for its speeds of processing (retrieval, autocoding, text analysis) especially with large datasets. Further optimization and redesign allowed us to achieve even faster processing speeds, something that will be surely appreciated by those analysing very large data sets. Here are a few examples of speed improvements we obtained:
Link Retrieval – up to 15x faster
Saving of code statistics – up to 13x faster
Merging of projects – up to 15x faster
Extraction of comments – up to 10x faster
Loading of data in spreadsheet editor – up to 6x faster
Co-occurrence analysis – 3.5x faster
Automatic Classification 3.x faster
Sequence analysis – 2x faster
Code consolidation – 2x faster
16. SAVE CHART ANIMATION, ANIMATED GIF, OR POWERPOINT
QDA Miner 4.x introduced the ability to store rotating three dimensional graphics such as multidimensional scaling or correspondence plots in AVI movie files. We added in version 5.0 the ability to store those animations in a PowerPoint as well as in an Animated GIF file for more portability, more flexibility.
17. IMAGE ROTATION AND RESIZING
Imported images may be rotated and resized. Existing coding is automatically adjusted to the new size or image orientation.
18. IMPORTATION OF POWERPOINT
Presentations stored in PowerPoint .ppt or .pptx files or books in EPUB format can now be imported directly in QDA Miner 5.0.
19. NVIVO TO QDA MINER CONVERSION TOOL
Qualitative analysis is very time consuming, and moving from one qualitative software to another one would be a huge endeavor if one had to start from scratch. QDA Miner 5.0 integrates its NVivo to QDA Miner conversion wizard to guide you through the steps needed to convert your NVivo 7 to NVivo 11 project into a QDA Miner project (documents, images, codebooks, codings, memos, etc.).
20. IMPROVED LOCATION EXTRACTION AND GAZETTER GENERATION
Extract gazetteers from SHP, KML, KMZ, GPX or from our online geographical database.
21. ADDED VARIABLES WHEN COMPARING CODINGS IN WORDSTAT
A new variable selection feature allows one to include numerical, categorical or date variables when one use WordStat to compare text associated with QDA Miner codes.
22. NEW DATE & TIME VARIABLE
A new date and time variable has been added, allowing one to associated a precise time stamp to cases.
23. NEW TYPE TRANSFORMATIONS
New variable type transformations have been added for greater flexibility.
String -> Date & Time
Date & Time -> String
Nominal -> Date
Nominal -> Date & Time
String -> Integer
String -> Double
24. RECODING OF NUMERIC VARIABLES INTO ORDINAL VARIABLES
In order to transform numerical values into ordinal classes one had to transform the numerical variable into a string or an ordinal/nominal variable prior to the recoding operation. The improved RECODE dialog box can now automatically detect when a nominal variable is needed and perform the variable type transformation and recoding in a single operation.
25. CATEGORY MEMOS
It is now possible to attach a memo to a codebook category.
26. MOVING COLUMNS IN TABLE REPORTS
Columns in many tabular reports may now be reordered using simple drag-and-drop operations.
27. RESIZING OF STRING VARIABLE
String variables can be resized, allowing one to store longer string of text or strip down long variables.
28. IMPORT DOCUMENT CREATION DATE
A new option has been added to import the document creation date.
29. IMPROVED SUPPORT FOR MULTILINGUAL DOCUMENTS
Faster display, better support of multi-languages including right to left languages.